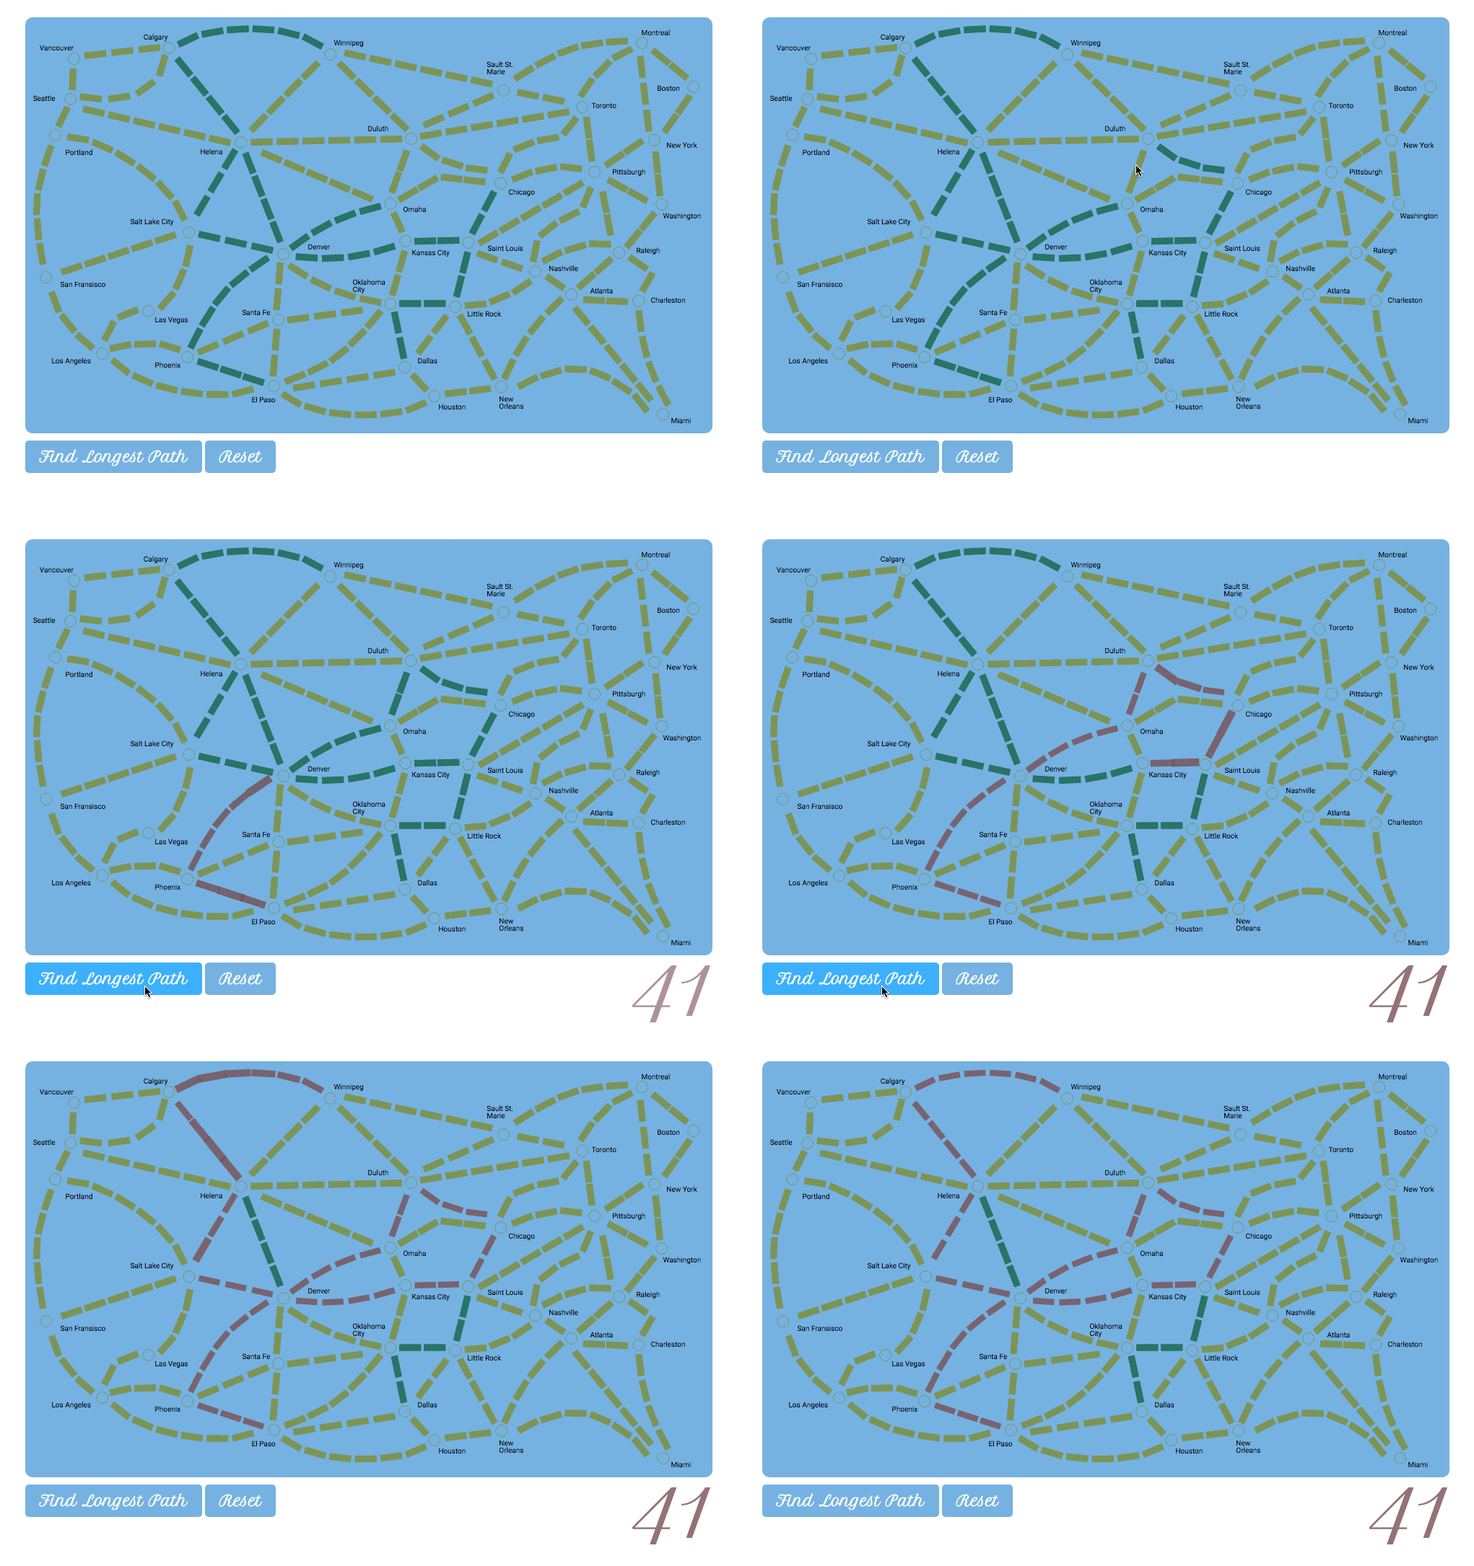
Ticket to Ride Longest Trail
An animated, interactive visualization of Ticket To Ride longest trails
A while back, as an exercise, I wrote a Python algorithm for finding the longest continuous trail given a set of paths on the board game “Ticket to Ride.” For those not familiar with the game, players work to build train “routes” and connect cities together on a board that resembles the continental United States. At the end of the game, the player with the longest continuous route wins additional bonus points. The routes are weighted and can sprawl all over the map, so figuring out the best route can take time.
Wanting to explore graph algorithms and develop my Python chops a bit, I built a command line based Python application that took a list of a player’s routes, and spit out a longest trail (meaning no route could be used twice and all routes had to connect). I optimized it somewhat and built a concurrent version, then set it aside and moved on to other things.
A few months later, I was playing around with SVGs and animation and realized it might be a nice tool to add a front-end to the Python algorithm. The problem was I was more comfortable with NodeJS back-ends, not Python-based ones. But after some research I turned up a method to call Python scripts from Node.
The next challenge was getting the SVGs created and the animations working, which I hadn’t worked much with in the past. However, thanks to the incredibly useful Snap.svg (and some patient assistance from the maintainers) I was able to build the map in Inkscape and have a working SVG layout fairly quickly.
With the two ends working (if not particularly attractive) all that was left was to connect everything together, test, pretty things up a bit with some CSS, test some more, debug, test again, and voila!

The next challenges would be getting a cloud hosting setup that would support Python and Node running concurrently, and ensuring there are no security issues with such a setup (since Node is programatically running shell commands).
Last updated: June 22, 2017